Let’s continue the analysis of the case presented and discussed in previous posts (here and here).
Many readers have lingered on the oscillations which can be seen on the pressure trace (and, to a smaller extent, on the flow trace). Two interpretations were given: 1) they are a sign of the patient’s respiratory activity, not in sync with the ventilator; 2) they are cardiac artefacts.
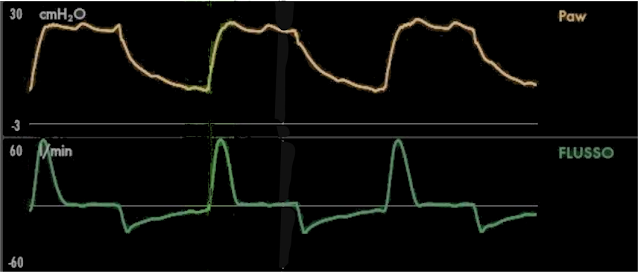
In order to understand which interpretation is correct (or if both are) let’s analyze the traces (see Figure 1) systematically using the RESPIRE method (see this and this post in Italian -to be translated in English soon).
The steps R (Recognizing important curves) and E (Exhalation - ventilator) have already been proposed in Figure 1 and 2 on this post.

|
Figure 1 |
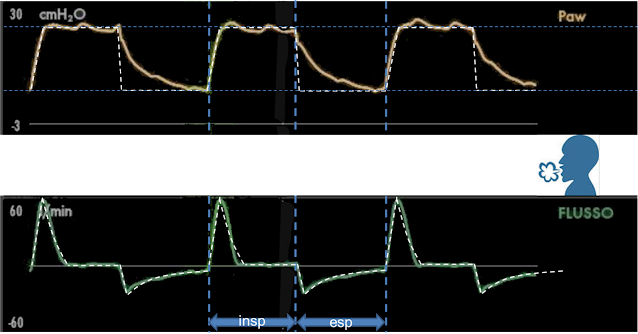
Now lets process with the S (Suppose the patient is passive). With pressometric ventilation, we expect to see a constant inspiratory pressure and decreasing flow. Expiration, in any ventilation modality, should have a constant pressure (at PEEP level) and a decreasing flow. The white dashed line in Figure 2 shows how the curves could be if the patient did not have any respiratory activity.

|
Figure 2 |
Now let's see where to place the patient (P): in the middle between the pressure trace (above) and the flow trace (below) (Figure 3),
|
Figure 3 |
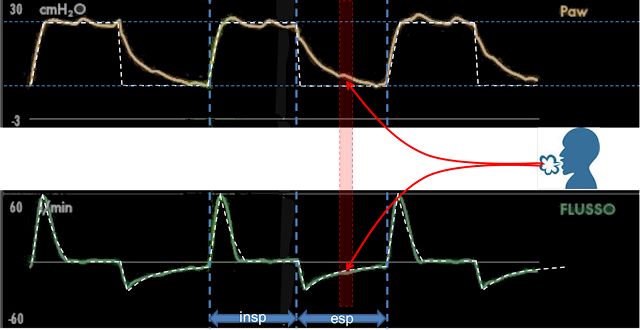
and let's start to think about how the patient's possibile inspiratory activity (I) might modify the curves (Figure 4).

|
Figure 4 |
With the RESPIRE method (which has a physiological basis which we are not going to discuss here for the sake of simplicity), the patient’s inspiratory activity “attracts” the curves towards his position: it “raises” the flow trace and “lowers” the pressure trace compared to what we would expect.
In case of patient’s activity, the variations in flow and pressure must both agree with each other, meaning that both traces have to “move towards” or “move away” from the patient. Patient’s activity could be evident on one of the two curves only: only on the flow trace during ventilator’s expiratory time, on flow or pressure (depending on the mechanical ventilator in use) during ventilator’s inspiratory time. If the variations of flow and pressure are not in agreement, meaning that one curve “moves towards” while the other “moves away” from the patient, this can never be attributed to the patient's activity.
Looking at inspiratory flow in the area shown in Figure 4 (“insp”), we can see a little flow increment compared to what we would expect (the curve moves towards the patient). If this was due to patient activity, the airway pressure should decrease (move towards the patient) or stay unchanged. In this case we can see that, in the highlighted area, airway pressure is slightly higher than what we can see in other parts of inspiration (it moves away from the patient) and, using RESPIRE, we attribute this condition to expiratory activity. When flow and pressure suggest antithetical respiratory activities (inspiration on the flow trace, expiration on the pressure trace) we can exclude that this can be attributed to patient's activity: we can therefore conclude that, on these images, there is no patient’s inspiratory activity.
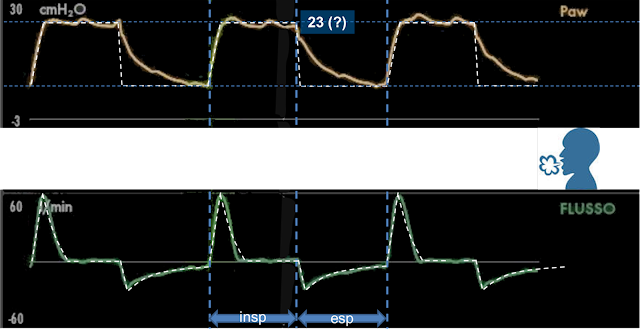
The next step is to search for the moments when pressure remains constant and flow is absent (R: release/relaxation): this is the only condition during which the pressure measured by the ventilator becomes the same as the pressure in the lungs.
|
Figure 5 |
The phase without flow at a constant (although there are small oscillations) pressure can be seen at the end of inspiratory flow. The pressure value in the mechanical ventilator is 23 cmH2O (Figure 5), which is the pressure in the patient’s lungs at the end of inspiration if it is obtained in the absence of any patient’s expiratory activity (we have already excluded the presence of any inspiratory activity in the previous step).
We are going to end this analysis by trying to find the patient’s expiratory activity (E).
In Figure 6 and 7 we can see two short, minimal but obvious drops in flow, one during inspiration and one during expiration.

|
Figure 6 |
In both cases, we can see at the same time a rise in pressure. They appear therefore to be signs of the patient’s expiratory activity.
The oscillations in airway pressure are frequent and regular: we can see 13 of them in the 7 seconds of recording (Figure 8), corresponding to about 110 oscillations per minute.

|
Figure 8 |
This was very similar to the patient’s heart rate. We have to conclude that the airway pressure variations (and minimal flow variations) are cardiogenic oscillations, meaning that they are induced by the patient’s heart beat.
This gives rise to two interesting considerations:
Cardiogenic oscillations are expression, to all effects, of the patient’s respiratory activity, which originates from the patient’s heart beat instead of originating from the activity of the patient’s respiratory muscles.
Cardiogenic oscillations induce the variations of pressure in the lung, which are behind pressure and flow variations. This is just like the respiratory muscles, which generate alveolar pressure variations (although of much greater entity) in order to originate airway flow. For this reason, RESPIRE identifies cardiogenic oscillations as patient’s respiratory activity, and don’t make a distinction between the heart or respiratory origin since they have, from the mechanical point of view, the same impact.
2) The mechanism behind cardiogenic oscillations is far from trivial. If we observe them in Figure 8, the positive peaks generated by cardiogenic oscillations on the airway pressure trace (where you can see the dashed white lines) remind us of vascular pressure peaks during systole.
Beyond their morphology, their duration is more in agreement with the lesser duration of systole compared to diastole.
If we think carefully, matching the peaks due to cardiogenic oscillations with systole is in contradiction with the variation in heart volume: in fact, during systole the heart volume decreases, therefore its imprint on the lungs should decrease, generating a small pulmonary expansion and a subsequent reduction in intrapulmonary pressure: just the opposite of what we have observed in our case.
Nonetheless, during systole the intrathoracic vascular volume increases and the pulsatile wave of the pulmonary artery is transmitted to gas contained in the airways. Both these mechanisms increase the vascular imprint on aerated spaces and therefore increase the intrapulmonary pressure during systole.
Cardiac contractions and pulmonary artery pulse induce volume and pressure variations of opposite sign on the alveoli.
The direct effect of the heartbeat manifests itself clearly on the iuxta-cardiac lung areas (especially on the lower left lobe), while in other areas of the lung the variations have an opposite direction compared to the inferior left lobe (1, 2).
This data can be consistently interpreted as follows: in the lower left lobe, the prevailing mechanism is that of the direct compression-decompression of the heart on the lungs, i.e. the heart volume reduces in systole and the lung parenchyma expands in systole while the opposite happens in diastole. In the other areas of the lung the direct transmission of the heartbeat is not relevant, but the systolic increase in intrapulmonary blood volume and the direct transmission of the arterial pulmonary blood vessels’ pulsatile wave becomes significant, with an increase of compression of lung aerated spaces in systole and their decompression in diastole. The total net effect sees the prevalence of the impact of pulmonary artery pulse on heart contraction, as we can perceive from our case-study by observing a systolic peak on airway pressure.
This interpretation is confirmed by the observation that the cardiogenic oscillations persist with an open chest cavity, when the heart is not in direct contact with the lungs and that they are eliminated by clamping the pulmonary artery while the heart is still beating (3).
Let’s finish our analysis of expiratory activity by focusing our attention on the last very evident difference between the hypothetical curves obtained with a passive patient and the ones effectively recorded. During the expiratory phase, we can see that the pressure stays well above the applied PEEP level for a long time, and that PEEP level is reached only at the end of expiration (Figure 9).

|
Figure 9 |
This behaviour is definitely abnormal, and it could be due to the expiratory activity of the patient only if it were associated with an increase in expiratory flow, which we do not see. The flow decreased exponentially during the entire expiration, as usually happens for passive patients. Moreover, we can see that the absolute value of the expiratory flow’s peak is significantly lower than the inspiratory flow’s peak. This confirms the fact that it is unlikely that this could be due to the patient’s expiratory activity, since it would eventually increase the expiratory flow’s peak.
In absence of any expiratory activity, we must conclude that an expiratory airway pressure higher than expected is due to a problem in the ventilator. We will discuss this extensively in a future post.
In conclusion, our analysis of patient-ventilator interaction shows that any respiratory muscles’ activity is absent for the entire duration of the respiratory cycle: the patient is completely passive.
There is a patient’s activity which can be seen on the graphical monitoring, and which is due to the heartbeat (the cardiogenic oscillations). The cardiogenic oscillations are indistinguishable, when using RESPIRE, from patient’s activity because they are respiratory movements generated by intrathoracic pressure variations: only their small impact on flow and airway pressure, which is frequent and regular, and present in all the phases of the respiratory cycle, lets us discriminate cardiogenic oscillations from respiratory muscles’ activity.
While waiting to discuss what really got my attention while examining this case, I send a smile to all of ventilab’s friends, as always.
References
Collier GJ, Marshall H, Rao M, Stewart NJ, Capener D, Wild JM. Observation of cardiogenic flow oscillations in healthy subjects with hyperpolarized 3He MRI. J Appl Physiol 2015; 119:1007-1014
Dubsky S, Thurgood J, Fouras A, R Thompson B, Sheard GJ. Cardiogenic airflow in the lung revealed using synchrotron-based dynamic lung imaging. Sci Rep 2018; 8:4930
Suarez-Sipmann F, Santos A, Peces-Barba G, Bohm SH, Gracia JL, Calderón P, Tusman G. Pulmonary artery pulsatility is the main cause of cardiogenic oscillations. J Clin Monit Comput 2013; 27:47-53